I consider myself to be a fairly rugged and scrappy individual. My policy is that if the high is above 40°F, shorts and a hoodie are acceptable wear. However, I do have a limit when it comes to thermal comfort, which has recently been tested by the windows at the Phius office. My hands are cold — very cold.
The Phius office is located in Chicago’s iconic and historic Monadnock building, a soaring masonry monolith from the drawing board of Daniel Burnham and John Root, the tales of whom drove me into the architecture and engineering profession. Well, no discredit to my forefathers, but there have been some advancements in building enclosure design since 1891 when the Monadnock was built.
Our office is a west-facing suite in the northern half of the building — the infamous load-bearing half with six-foot-thick walls at the base — that is well daylit, with massive 7-foot-tall windows. Anyone who has ever talked to a passive building professional knows we are nuts when it comes to windows, and in this case, I am guilty as charged. The installed windows in our office are wood-framed, single-pane, single-hung, and are causing me some issues.
My desk is up against the wall, with my left shoulder facing the window, and my left hand usually about 1-2 feet from the glazing. This hand gets cold, making it slow for me to send emails, write Python for a data analysis script, or even type out comments into a feedback form. So, before I complained to anyone (and now look, I have a platform to air my grievance to the world) I figured I would do a little data collection. This is where my scrappiness comes in.
I could have borrowed some sensors from my alma mater, Illinois Tech, to measure air and surface temperatures of the window to get some precise and solid data. But I have been wanting to play with Raspberry Pis (little micro computers) and better learn how to integrate sensors into them, and I could do it for cheap compared to buying the sensors myself. So, at 11 p.m. one night, much to my wife’s chagrin, I grabbed a Pi, some DHT22 temperature and humidity sensors and headed to the basement. I have used the DHT22 sensors before, albeit with an Arduino microcontroller rather than a Raspberry Pi. But, I found a handy article that explained what was needed to connect the sensor to the Pi, and a sample script I used to log the data to a csv file.
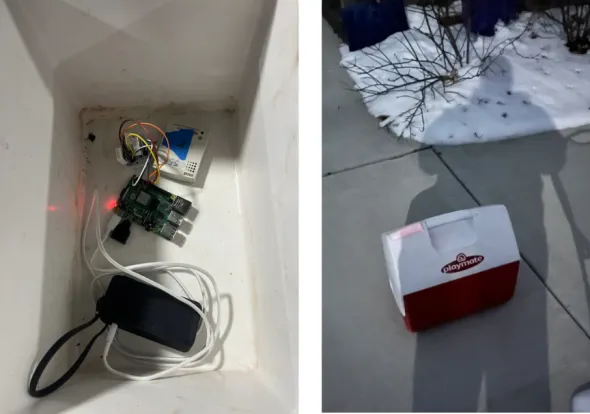
Figure 1. Raspberry Pi, battery pack, and sensors installed in the ACHU, and placed outside in cold weather
Now, the DHT22 is not a state-of-the-art piece of sensor equipment, but they are fairly cheap. I paid $5 a piece for the two used in this experiment, another $75 for the Pi, and $10 for the wire, so this whole data logging rig is less than $100 to set up — about half the price of the equivalent Hobo Logger (of which I would need two of in this instance). This temperature sensor is accurate to +/- 0.5°C, with a range from -40°C to 80°C, so it meets the requirements in which I will need it to operate. However, I wanted to make sure all the readings agree with one another, since the margin of error is high, so I grabbed my red Igloo Advanced Calibration Housing Unit (ACHU) and co-located the DHT22 sensors in there. To power the Pi while I took the ACHU outside of the house to get a temperature decay curve, I used a power pack for charging my cell phone on the go. See Fig. 1.
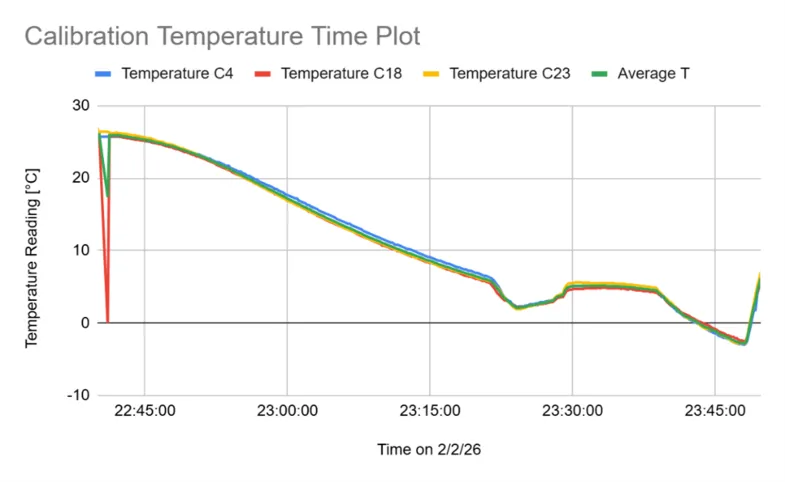
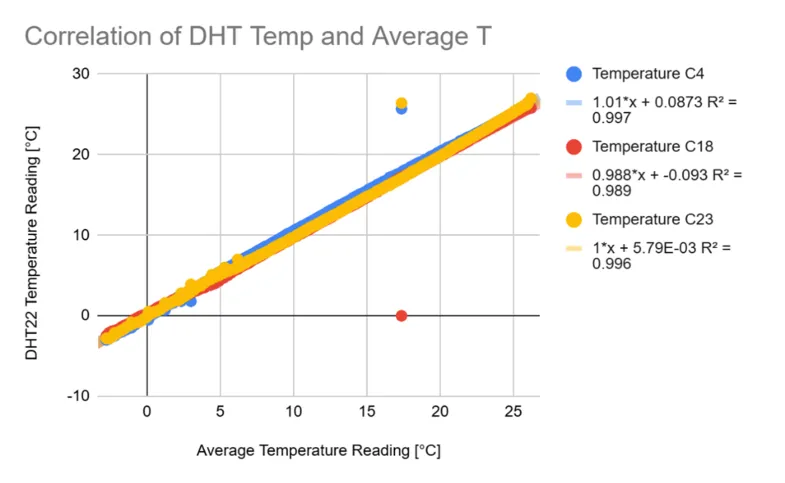
In the Calibration Temperature Time Plot, I plotted the minute time step readings from the three sensors I tried to calibrate, and they look fairly good in agreement, but there is some jitter. So I plotted the readings of each individual sensor with the average temperature reading of all three, shown in the
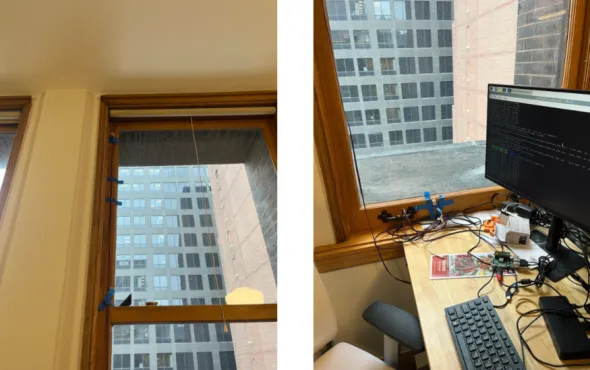
Figure 2. These images show the DHT22 installed at the top and bottom of the window.
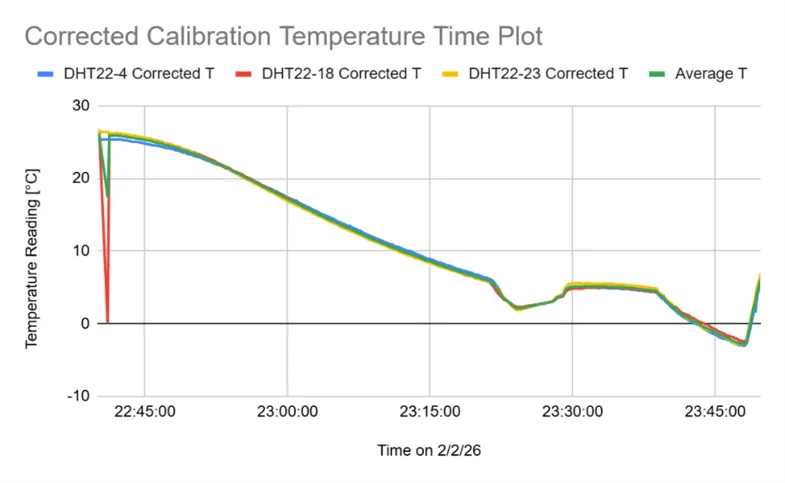
Correlation of DHT Temp and Average T graph. From this, I used a linear regression to determine a correction factor for each of the temperature readings from each of the sensors. Be mindful of if the correction needs to be added or subtracted from the readings when programming in correction factors. The first time I made the Corrected Calibration Temperature Time Plot graph, the jitter got worse, and I spent some late-night minutes trying to figure it out.
After I had my sensors calibrated and my data logging script functional, it was time to deploy the sensors. Standing on my desk in an OSHA-compliant manner, I taped one of the DHT22 sensors to the top of the window frame, and the second one on the bottom, right near my hands. I wanted to see the stratification impacts of the large single-pane windows, and confirm that I do in fact have the right to complain that my hands are cold. See Fig. 2 for the installation of the sensors. See the graph for Window 3 Temperature Measurements for details.
So with this data, what can I conclude? Well, the area immediately adjacent to my hand is pretty dang cold, especially in the afternoon when the sun hits the window and the radiator cycles less frequently to maintain setpoint. The coldest I experienced while sitting there was 12.5°C (54.5°F), which is cold on my fingers. But look at the stratification! It is on average 1.8°C (3.3°F) colder by my hands than at the top of the window. And when the radiator, which is two windows over from mine, is cycling, this delta is greater. I get a nice amount of radiant asymmetry and down draft discomfort, neither of which I measured with instruments, so this cold air temperature is only part of the puzzle.
Additionally, our 1891 office building boasts a site EUI of 39 kBtu/sf yr, about which I have always been a little curious. From the monitored temperatures, it is clear that heating is on a major setback over the weekend, so I suspect heating the building to setpoint 5/7ths of the winter probably helps with reducing energy consumption. I would have never known unless I monitored the temperature in our office (because am I really going to be there on the weekend?).
So my hands are still cold, and I have the data to prove it. Big whoop. Why did I write this rant for you all anyways?
Well, even though I love my modeling tools, sometimes there is something tactile about getting out and measuring something. I know some people would love to do some measuring of conditions to validate their modeling, or just to confirm a suspicion they have about something not working correctly. The reason this usually does not happen is because of the lack of equipment availability for most people. So, dear reader, if you do not have measuring equipment, but have a little determination, you can build it for yourself. I believe in you.